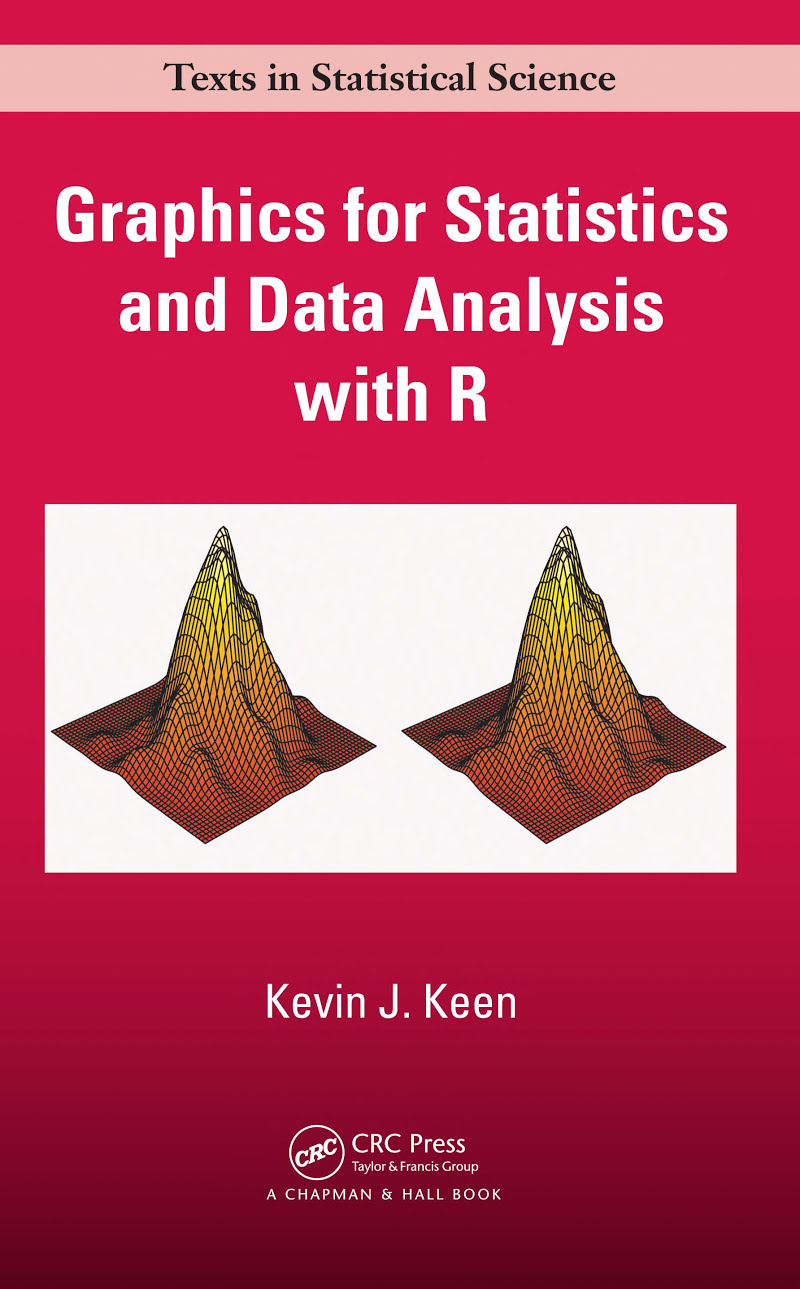
Graphics for Statistics and Data Analysis with R

Graphics for Statistics and Data Analysis with R

by Kevin J Keen

489 pages· 2010· ISBN 9781584880875

Browse books you can read free on Readfeed

No club is reading this yet — be the first to start one

Start a club free
About
Graphics for Statistics and Data Analysis with R presents the basic principles of sound graphical design and applies these principles to engaging examples using the graphical functions available in R. It offers a wide array of graphical displays for the presentation of data, including modern tools for data visualization and representation. The book considers graphical displays of a single discrete variable, a single continuous variable, and then two or more of each of these. It includes displays and the R code for producing the displays for the dot chart, bar chart, pictographs, stemplot, boxplot, and variations on the quantile-quantile plot. The author discusses nonparametric and parametric density estimation, diagnostic plots for the simple linear regression model, polynomial regression, and locally weighted polynomial regression for producing a smooth curve through data on a scatterplot. The last chapter illustrates visualizing multivariate data with examples using Trellis graphics. Showing how to use graphics to display or summarize data, this text provides best practice guidelines for producing and choosing among graphical displays. It also covers the most effective graphing functions in R. R code is available for download on the book’s website.

Discuss Graphics for Statistics and Data Analysis with R with other readers

Join or start a book club for Graphics for Statistics and Data Analysis with R on Readfeed. Live chat, shared reading progress, and AI discussion questions — free to get started.

Frequently asked questions

How do I join a book club for Graphics for Statistics and Data Analysis with R?

Sign up free on Readfeed, then browse public clubs or start your own club with Graphics for Statistics and Data Analysis with R as the current read. Invite friends with a share link and discuss together with live chat and AI discussion questions.

Can I discuss Graphics for Statistics and Data Analysis with R with other readers online?

Yes. Readfeed book clubs let you chat live, share progress, and join discussions about Graphics for Statistics and Data Analysis with R with readers worldwide — whether your club is virtual, in-person, or hybrid.

Is Readfeed free?

Yes. Creating an account and joining book clubs is free. Sign up to find readers who love the same books and start discussing today.