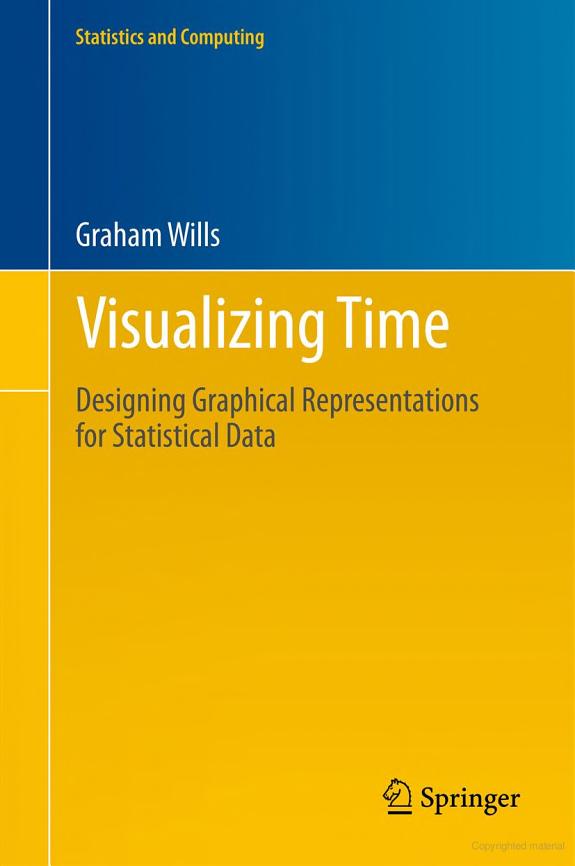
Visualizing Time
Designing Graphical Representations for Statistical Data
by Graham Wills
256 pages· 2011· ISBN 9780387779072
About
Art, or Science? Which of these is the right way to think of the field of visualization? This is not an easy question to answer, even for those who have many years experience in making graphical depictions of data with a view to help people understand it and take action. In this book, Graham Wills bridges the gap between the art and the science of visually representing data. He does not simply give rules and advice, but bases these on general principles and provide a clear path between them This book is concerned with the graphical representation of time data and is written to cover a range of different users. A visualization expert designing tools for displaying time will find it valuable, but so also should a financier assembling a report in a spreadsheet, or a medical researcher trying to display gene sequences using a commercial statistical package.
Discuss Visualizing Time with other readers
Join or start a book club for Visualizing Time on Readfeed. Live chat, shared reading progress, and AI discussion questions — free to get started.
Frequently asked questions
How do I join a book club for Visualizing Time?
Sign up free on Readfeed, then browse public clubs or start your own club with Visualizing Time as the current read. Invite friends with a share link and discuss together with live chat and AI discussion questions.
Can I discuss Visualizing Time with other readers online?
Yes. Readfeed book clubs let you chat live, share progress, and join discussions about Visualizing Time with readers worldwide — whether your club is virtual, in-person, or hybrid.
Is Readfeed free?
Yes. Creating an account and joining book clubs is free. Sign up to find readers who love the same books and start discussing today.